
With MediConnect Analytics® you have a valuable, flexible report engine at your fingertips that enables you to view your key figures at a glance. With defined templates, the key scientific and economic aspects can be presented in tables or graphics at the push of a button on the basis of the MediConnect® databases and optionally by integrating further SQL databases.


MediConnect Analytics® basic module
MediConnect Analytics® supplements the MediConnect® statistics with graphical analyses based on definable “dashboards”. Just like MediConnect®, Analytics® is based on Microsoft technology such as .NET and the SQL database. It can be installed on medical workstations as well as in the fields of administration or research. Dashboards can contain several elements for displaying data. In addition to a tabular data output, graphics can also be used for illustration purposes. Filter options allow a targeted analysis of the displayed data directly in the dashboard. For example, it is possible to filter by the time period, the type of examination, or the measured or recorded data. Both economic and scientific analyses are available at the push of a button. Calculations within the dashboards provide additional options. For example, differences in values can be displayed and data can be easily monitored. The data displayed in Analytics® can also be exported for further processing.

Quality assurance
Dashboards in the field of QA visualize various key figures for checking and monitoring the derived cases. For example, the number of QA sheets successfully transferred to the QA software used and the QA sheets not transferred due to errors or missing data can be monitored. These data can be filtered for different areas, for example to check only heart catheter interventions, only implantations, or valve interventions. The results are presented in both tabular and graphical views. Additional dashboards as an “error list” provide an overview of the QA sheets if information on the examination is incomplete. This makes it easy to identify cases where data still need to be collected for successful derivation.
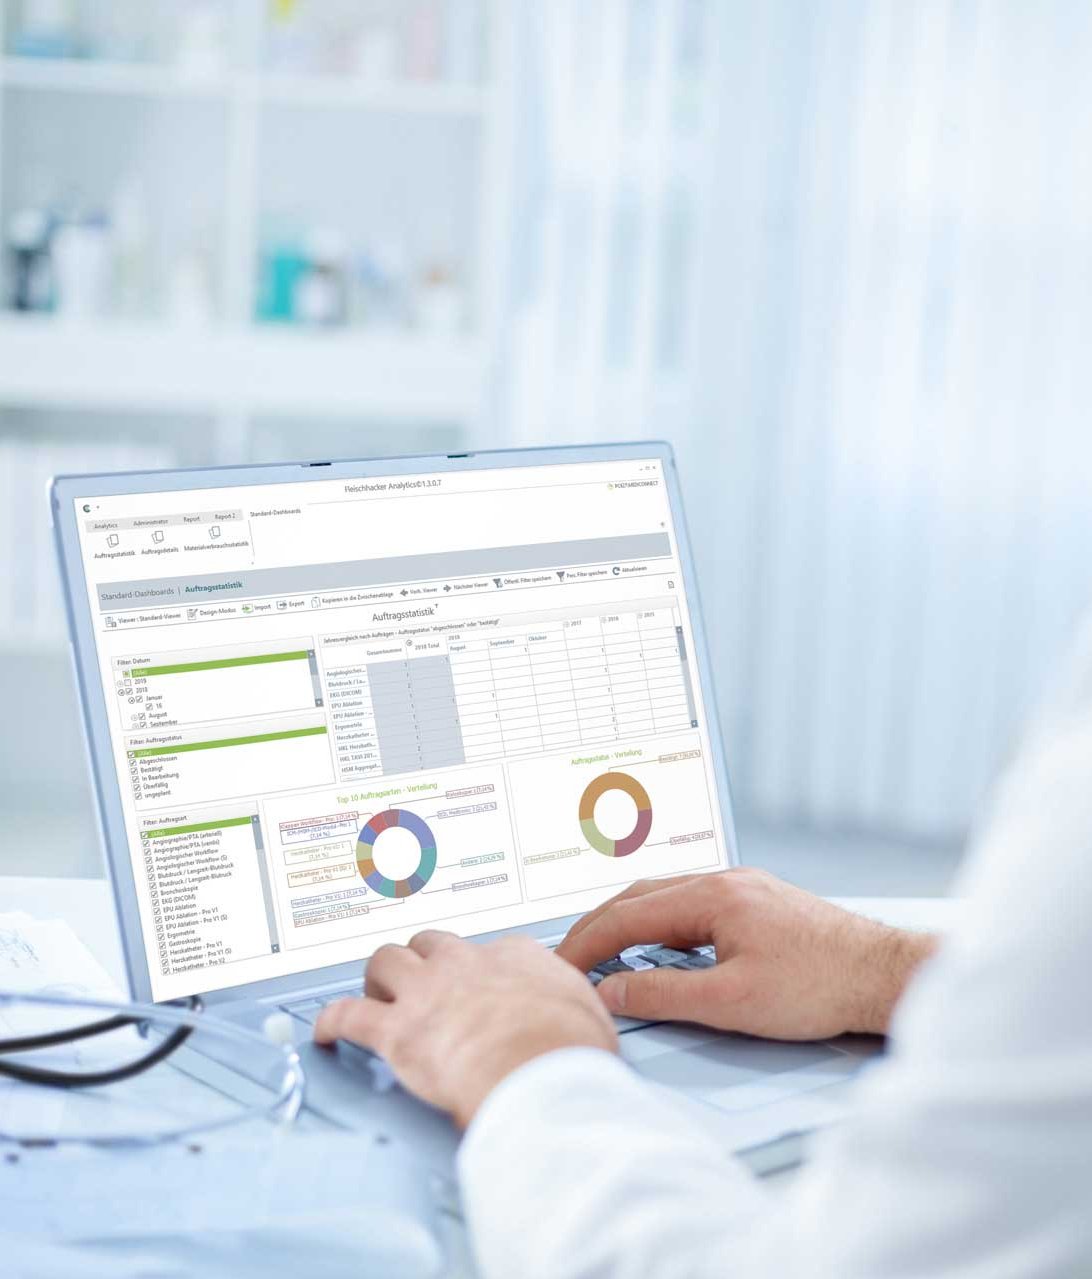
Investigation statistics
Investigation figures for order monitoring are presented in the dashboards. The graphical and tabular presentation of data makes it easy to compare the development of the figures of the individual types of examinations used. Questions, such as how the number of heart catheter examinations or valve interventions performed are developing, can be easily answered. Comparisons can also be made for defined periods of time. Examinations can also be considered in terms of how many examinations are performed for various requesting wards and facilities.
Statistics of materials management
In the field of materials management, dashboards can be used to answer a wide range of questions. In financial controlling, for example, item purchases can be analyzed by supplier or manufacturer, or material costs can be monitored on a case-by-case basis. In the medical field, frequently used materials can be identified or consumed materials can be filtered by serial or batch number and the respective patients.

Individual workflow analysis
In both the medical and the scientific field, it is of great interest to analyze the data collected and measured in MediConnect® examinations. MediConnect Analytics® make it possible to process the data recorded from workflows and technical examinations. For this purpose, all graphical elements, tables, pivot tables in combination with various filter options, and calculated values can be used to filter and sort the data according to specific questions. Thanks to the flexibility of the analysis options, MediConnect Analytics® offers exactly the right functionality for analyzing the individually designed diagnostic workflows from MediConnect®.
for a free presentation